In order to get the most benefit from this tutorial, I highly recommend that you download the *.pdf of the big chart, open that up and follow along.
Here is the link to the Planetary Biology model (big chart)
Planetary Biology model - big chart
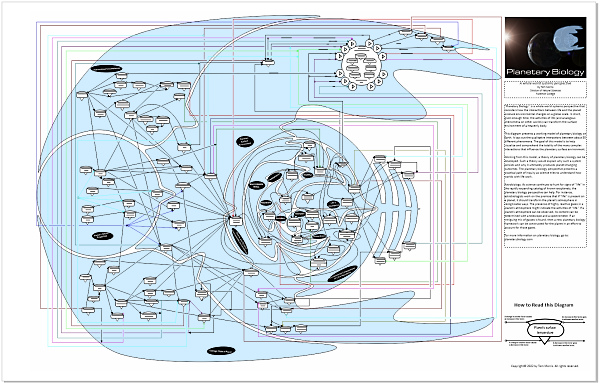
Planetary Biology model - the big chart. Image created by Tom Morris / PlanetaryBiology.com
Let's zoom out and survey the terrain in the image above. What we're seeing is an enormous flow diagram composed of about 80 nodes -- all linked together in an apparent spaghetti wad of confusion. BUT... but we can translate it and appreciate its significance. In order to do that, let's first get rid of all of those distracting lines.
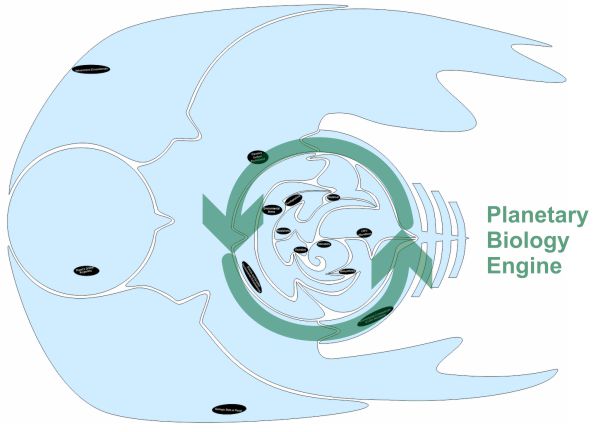
Planetary Biology model - phenomenal zones. Image created by Tom Morris / PlanetaryBiology.com
The basic layout of this diagram is organized into 14 interconnected "Phenomenal Zones." The best way to follow this diagram is to go from left to right. You can see the little points crafted into the phenomenal zone boundaries. Those indicate the general direction of that zone's influence. If you follow those points to the right, you end up where the planetary surface environment influences a circular pattern. That circular region is composed of biological phenomena that feedback on themselves, and then eventually feedback to influence the planetary surface environment phenomenal zone.
That circular region represents the core engine of planetary biology. It goes something like this: The planetary surface environment provides a setting of diverse and dynamic environmental circumstances. Life engages with and exploits the environment. This involves the origin of innovations, environmental stress, adaptation, pre-adaptations, dispersal, growing planetary environmental influence -- which feeds back to transform the planetary surface environment -- which presents life with a new mix of diverse and dynamic environmental circumstances -- which life engages and exploits. And continue round and round.
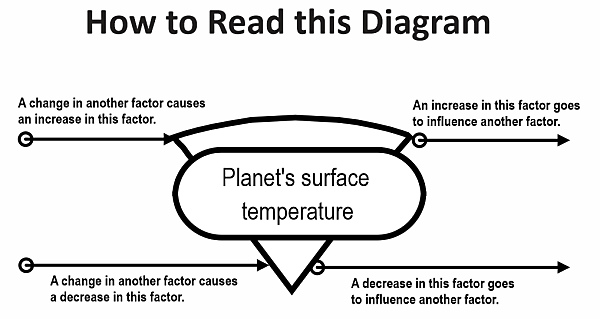
Planetary Biology model - how to interpret nodes. Image created by Tom Morris / PlanetaryBiology.com
The shape of the nodes is intended to be used to express two dynamic influences: Increases; Decreases.
The wider top of the node graphic is the "Increases" part. The narrower bottom of the node graphic is the "Decreases" part. An arrow originating at the node and leading away to another node represents how the origin node influences the destination node.
At the origin node, if the arrow line starts at the TOP of the node graphic, then that means "An INCREASE in this node's phenomenon..."
At the origin node, if the arrow line starts at the BOTTOM of the node graphic, then that means "A DECREASE in this node's phenomenon..."
At the destination node, if the arrowhead points to the TOP of the node graphic, then that means that whatever behavior at the origin node causes an INCREASE in the destination node.
At the destination node, if the arrowhead points to the BOTTOM of the node graphic, then that means that whatever behavior at the origin node causes a DECREASE in the destination node.
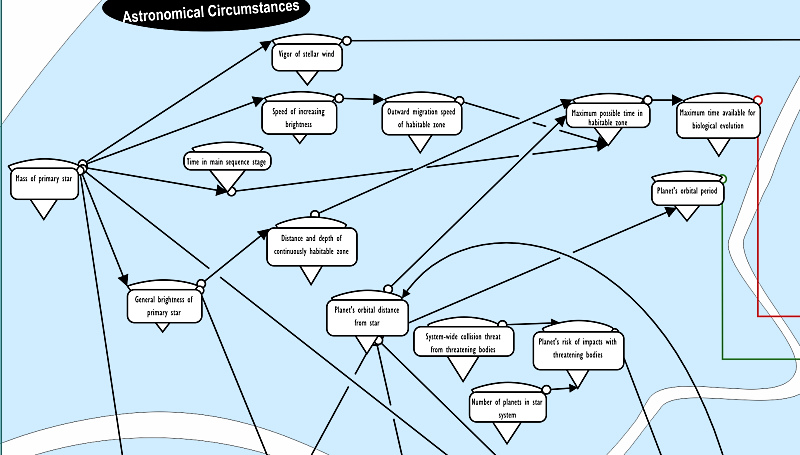
Planetary Biology model - Phenomenal zone: Astronomical Circumstances. Image created by Tom Morris / PlanetaryBiology.com
I'll try to get you kick-started by following the flow inside the Astronomical Circumstances phenomenal zone.
Starting at left with "Mass of Primary Star." Follow the arrows leading away from this node. Notice that increases in the mass of the primary star cause increases in the vigor of stellar wind, speed of increasing brightness, and general brightness of the primary star. Also notice that increases in the mass of the primary star cause a decrease in the time in main sequence stage.
Let's follow one of the chains. We see that as the speed of increasing brightness increases, this causes an increase in the outward migration speed of the habitable zone. And that causes a decrease in the maximum possible time in the habitable zone. We can interpret that decrease to cause a decrease in the maximum time available for biological evolution.
Let's follow another chain. An increase in the general brightness of the primary star will cause an increase in the distance and depth of the habitable zone. That increase will cause an increase in the maximum time in the habitable zone. This happens because the habitable zone gets wider as it migrates outward.
Now, go explore the diagram. I hope it generates many questions for you.